Speed profiling using KCachegrind
From Yade
With kcachegrind it is possible to determine how much time is spent in each call, when yade is performing calculations. It allows to identify methods which consume most of the running time so that if you want yade to run faster you know now where to make changes.
Kcachegrind uses output from callgrind - a tool offered by valgrind. To run kcachegrind just do this:
valgrind --tool=callgrind ./yade # will create a callgrind.out.XXX file upon exit
kcachegrind ./callgrind.out.21914 # will provide a graphical vizualization of profiling data included in that callgrind.out.XXX file
Of course the name callgrind.out.21914 will be different on each time.
I advise you to use command line interface to perform tests, so that kcachegrind will not show unnecessary information about time spent in the graphical interface. Like this:
valgrind --tool=callgrind ./yade -n -- -f ../data/model.yade -b -p -s 40 -m 20000 -t 0.1
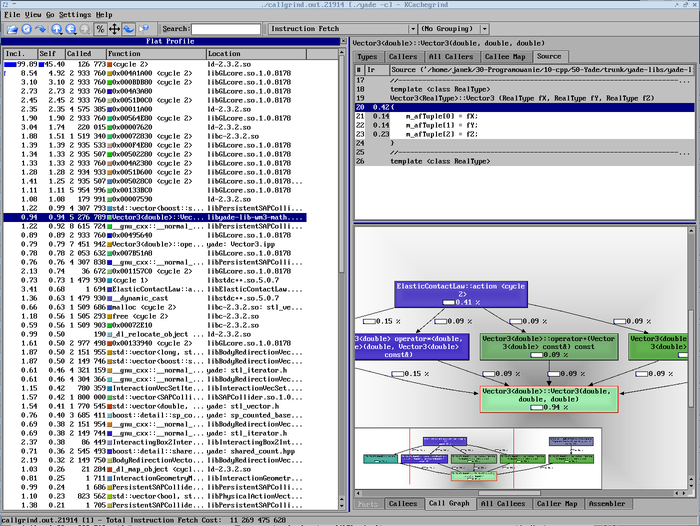
Using QtGUI can give misleading results, because time spent inside libGLcore is a time spent on drawing not calculating - this is the case with the screenshot below.
Below is a sample screenshot of kcachegrind in action. You can see how much time (in % of total running time) was spent in each method. More important here is the second column titled "Self". Also it is possible to look at the source code of selected method (only if that source code is available - ie. it is a part of yade source), so the investigated part is instantly visible.
