ScriptPlotInteractionForcesHistogram
From Yade
<source lang="python"> import pylab # the matlab-like interface of matplotlib import numpy
- run uniax.py to get this file
- or just get some data from TriaxialTest, whatever
O.load('/tmp/uniax-tension.xml.bz2')
- axis normal to the plane in which we do the histogram
axis=0 # x, i.e. plot the yz plane ax1,ax2=(axis+1)%3,(axis+2)%3 ## get the other two indices, i.e. 1 and 2 in this case angles,forces=[],[] for i in O.interactions: if not i.isReal: continue norm=i.geom['normal'] angle=atan(norm[ax2]/norm[ax1]) force=i.phys['normalForce'].Length() angles.append(angle) forces.append(force)
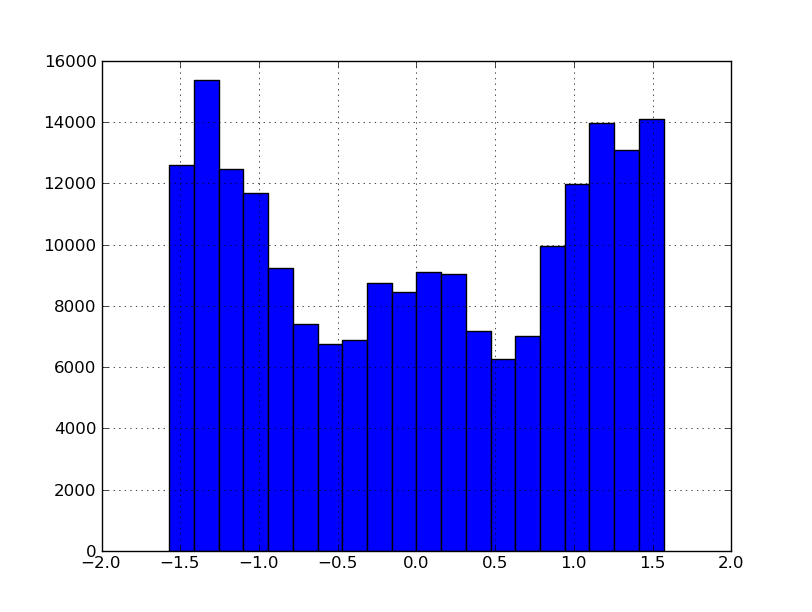
- easier: plain histogram
pylab.hist(angles,weights=forces,bins=20) pylab.show()
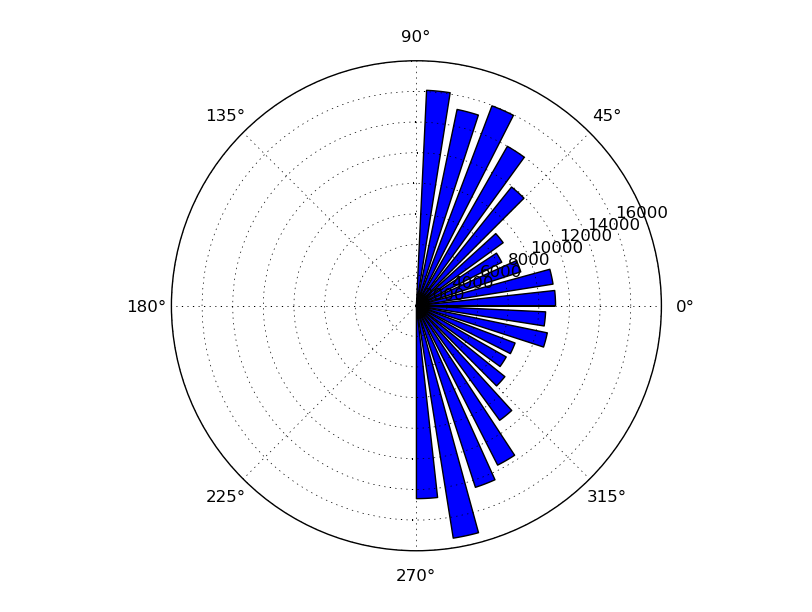
- polar histogram
- prepare data
values,bins=numpy.histogram(angles,weights=forces,bins=20)
- prepare polar plot
pylab.subplot(111,polar=True);
- plot bar chart, with the histogram data
- bins has one edge extra, remove it: [:-1]
- plot bar chart, with the histogram data
pylab.bar(left=bins[:-1],height=values,width=.7*pi/20); pylab.show() </source>

