Difference between revisions of "Debugging using Kdevelop"
From Yade
| (4 intermediate revisions by 2 users not shown) | |||
| Line 1: | Line 1: | ||
[[Category:OldSite]] |
[[Category:OldSite]] |
||
| + | [[Category:OldSite]] |
||
| ⚫ | |||
| ⚫ | |||
| + | ''(Click on images to enlarge them to readable size)'' |
||
| + | ==Using "attach"== |
||
Debugging with kdevelop4 is quite easy using the "attach process" option. Other debugging methods where kdev4 would start the executable alone are not supported because kdev4 doesn't consider python executables. Also note that attaching yade while the Qt controller is not active will most probably not allow you to stop on breakpoints. |
Debugging with kdevelop4 is quite easy using the "attach process" option. Other debugging methods where kdev4 would start the executable alone are not supported because kdev4 doesn't consider python executables. Also note that attaching yade while the Qt controller is not active will most probably not allow you to stop on breakpoints. |
||
1. Start yade in a separate terminal (make sure it is compiled with debug symbols) |
1. Start yade in a separate terminal (make sure it is compiled with debug symbols) |
||
| − | 2. Find "attach process" in the Run menu, and browse running processes : you'll find yade with a small "X" icon. Select it and validate, this will freeze yade temporary (if Qt is not open there will be a console application icon, as discussed above it is not suited for debugging). |
+ | 2. Find "attach process" in the Run menu of kdevelop4, and browse running processes : you'll find yade with a small "X" icon. Select it and validate, this will freeze yade temporary (if Qt is not open there will be a console application icon, as discussed above it is not suited for debugging). |
3. Now add breakpoints in yade code by right-clicking in the left margin of source files. |
3. Now add breakpoints in yade code by right-clicking in the left margin of source files. |
||
| Line 17: | Line 20: | ||
[[Image:kdev4_3.png|800px]] |
[[Image:kdev4_3.png|800px]] |
||
| + | ==Starting debug session from inside kdevelop== |
||
| − | ==Procedure for Kdevelop 3== |
||
| + | Alternatively, it is possible to start yade from inside kedevelop by configuring a debug launch. It that case, yade is attached automaticaly as soon as it starts. The behaviour is the same as the one described above. |
||
| + | The launch configuration is given in the snapshots below. |
||
| + | It is possible to start with a specific script by appending the target script in arguments (after "/usr/bin/yade --debug"). |
||
| − | When compiling yade for the first time, please do it from command line, so that a file <tt>scons.config</tt> will contain your compilation settings. After that you can start working using kdevelop. You can run kdevelop with command: |
||
| + | Note that the full path (e.g. /home/username/.../yade-dir/bin/yade-bzr-revno) must be provided for yade executable (and script eventually). |
||
| + | [[Image:Kdevelop-launch-debug.png|600px]] |
||
| − | cd yade-0.11.0 |
||
| + | [[Image:Kdevelop-launch-debug1.png|600px]] |
||
| − | kdevelop Yade.kdevelop |
||
| − | |||
| − | Or running it directly from konqueror by clicking on file <tt>Yade.kdevelop</tt>. When kdvelop starts for the first time it will ask to populate the project. Let it do this: |
||
| − | |||
| − | [[Image:kdevelop_populate.png|400px]] |
||
| − | |||
| − | Then you will need to go into project options to configure your paths and set number of processors to be used during compilation (because, unfortunately kdevelop overrides scons jobs setting): |
||
| − | |||
| − | [[Image:kdevelop_options.png|400px]] |
||
| − | |||
| − | [[Image:kdevelop_jobs.png|400px]] |
||
| − | |||
| − | [[Image:kdevelop_runpaths.png|400px]] |
||
| − | |||
| − | Then, after compiling yade you can try running it, and debugging, which should work without problems. |
||
| − | |||
| − | [[Image:kdevelop_debugging.png|400px]] |
||
Latest revision as of 17:00, 9 July 2014
Procedure for Kdevelop 4
(Click on images to enlarge them to readable size)
Using "attach"
Debugging with kdevelop4 is quite easy using the "attach process" option. Other debugging methods where kdev4 would start the executable alone are not supported because kdev4 doesn't consider python executables. Also note that attaching yade while the Qt controller is not active will most probably not allow you to stop on breakpoints.
1. Start yade in a separate terminal (make sure it is compiled with debug symbols)
2. Find "attach process" in the Run menu of kdevelop4, and browse running processes : you'll find yade with a small "X" icon. Select it and validate, this will freeze yade temporary (if Qt is not open there will be a console application icon, as discussed above it is not suited for debugging).
3. Now add breakpoints in yade code by right-clicking in the left margin of source files.
4. Click the "continue" button to unfreeze yade and do what you like (from python console or QtGui).
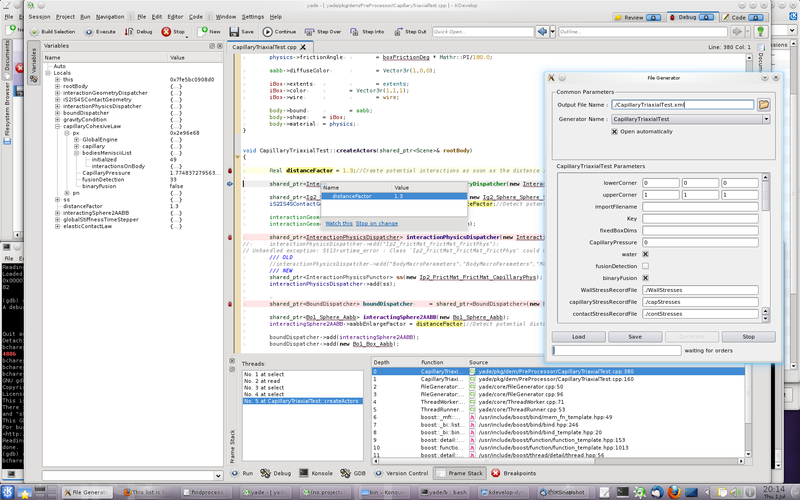
5. The debugger will freeze yade again as soon as a breakpoint is reached, and move back to kdevelp. It will let you inspect values, execute line by line, etc. Click "continue" again to quit debugging and run yade until the next breakpoint. The example below is debugging a pre-processor.
Starting debug session from inside kdevelop
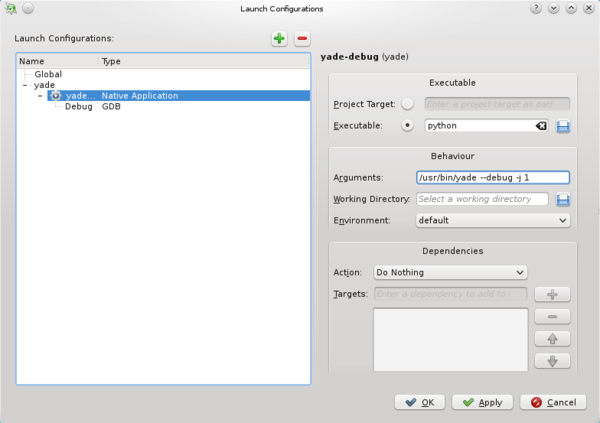
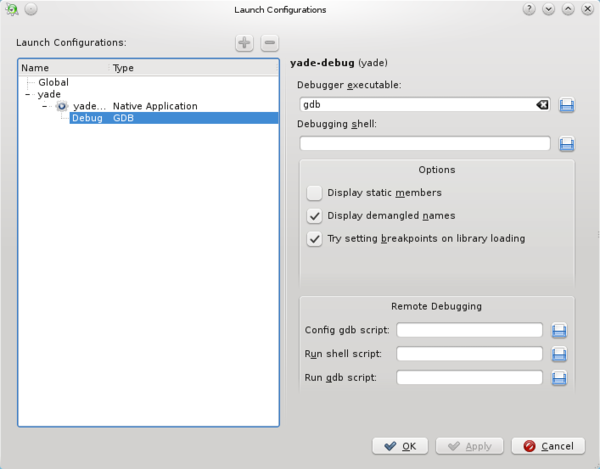
Alternatively, it is possible to start yade from inside kedevelop by configuring a debug launch. It that case, yade is attached automaticaly as soon as it starts. The behaviour is the same as the one described above. The launch configuration is given in the snapshots below.
It is possible to start with a specific script by appending the target script in arguments (after "/usr/bin/yade --debug"). Note that the full path (e.g. /home/username/.../yade-dir/bin/yade-bzr-revno) must be provided for yade executable (and script eventually).


