Scr:Other
From Yade
|
<categorytree mode=pages>Screenshots</categorytree> |
Gravity Test
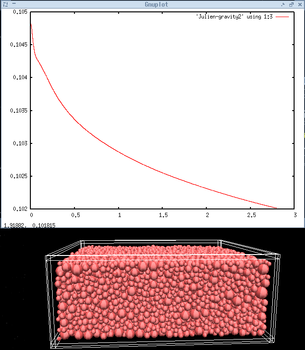
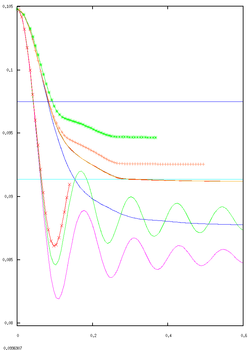
20 000 spheres of random size between 8 and 12mm are packed inside a small box 40 by 40 by 15cm and are subject to gravity test. This is a part of PhD work that studies damping effectes and energy dissipation of sand. Computations are performed using old SDEC program (tested for 10 years) and are compared with its yade reimplementation. Graph on the left represents average position in vertical coordinate of all spheres. Due to gravity movement of speciemen the curve is slowly going down. Graph on the right is represents also average vertical position of all spheres, but for different conditions. Smooth lines are with high damping value ( 0.7 ), and are calculated faster, for small damping ( 0.05 ) oscillation is observed. Blocking rotations of spheres results in smaller gravity compression and resultant average position is higher.
Walls smooth or rough
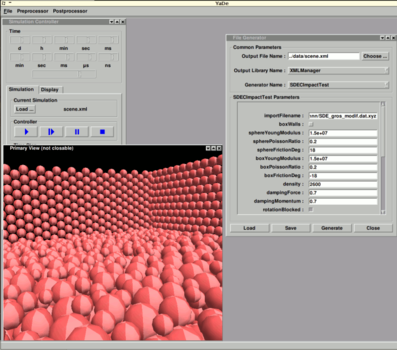
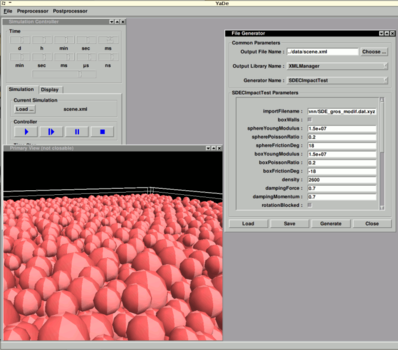
Gravity test can be performed with rough walls (on the left), where each wall is build out of spheres placed in a regular order. Spheres of granular material 'fall' into holes between spheres of the walls, thus wall is rough. Or walls can be represented as ideal box (on the right), and their surface is totally smooth. This results in higher gravity compaction of the speciemen.
Impact simulation
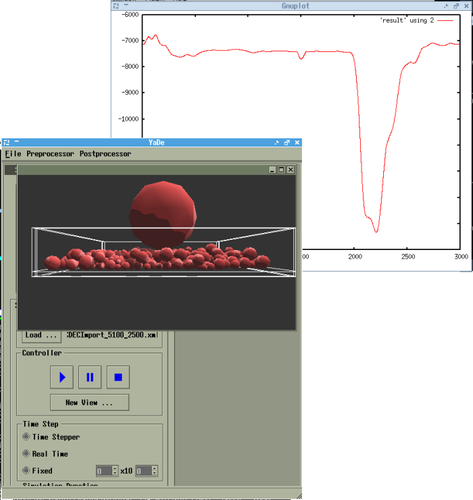
Small impact test was performed. A big steel ball was dropped onto a box filled with spheres (representing sand). Graph represents force recorded on the bottom wall of the box, during the ball impact.
Precision Test
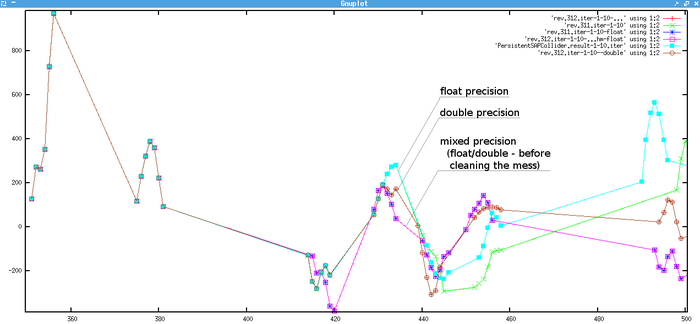
One of big surprises during numerical correctness tests was discovery of huge influence of numerical precision ( float / double ) on the results. Simulated system in general behaves chaotically, and butterfly effect can take place.
On graph above a shearing force between two spheres is plotted. Several test-runs were performed and different results were obtained, depending on numerical precision of computation. System behaves similarily on start, but after 410 iterations small difference occurs which later leads to huge changes, and on the end a totally different result emerges.
It should be noted that although numerical results for certain elements are different ( ie: shearing force between two spheres ), the overall system response for human eye seems very similar, and averaged shearing force should be measured to prove that.
Computational correctness Test
During the development yade has evolved in many many various ways. To make sure that this evolution did not introduce any kind of unwanted computational errors a certain test was performed. The same data file was loaded in various revisions and results of calculations were saved. Numerical differences of results between various code revisions were then investigated to locate the source of computational error.
